Google Core Web Vitals Basics: Everything You Need to Know
As you may know, SEO is a fundamental part of any web-based project, both in the short and long term. Positioning in the top search positions, as well as traffic and conversions, is crucial for the discovery and growth of a brand or company.
SEO involves many aspects, which are fundamental to provide the customer with an optimal user experience. Therefore, monitoring these aspects is crucial in the performance and improvement of our websites. Because of that, a myriad of tools were created to help in these tasks.
In this context, Google has Web Vitals, which analyzes the common website elements to determine the user experience on any page.
Want to know more about these and how to implement them? Keep reading!
What are web vitals?
As we already mentioned, Web Vitals belongs to a series of tools that Google provides as metrics to analyze web pages by analyzing fundamental usability aspects such as loading experience, interactivity, and visual stability. These aspects are the basis of an optimal user experience. These metrics and tools can be implemented in websites of any work field, providing improvement areas to these.
Web vitals is available as a Google Chrome extension, or it can be downloaded as an installable Javascript library for developers. Both alternatives are free and easy to use. In this case, we will explain it from the Chrome extension point of view.
Then...,
What are core we vitals?
Core Web Vitals are a subset of specific metrics applicable to any website, which are considered fundamental in measuring the user experience on a website. Each of these metrics, measures and compares the user experience on the website, simulating how it would interact in a real-time environment.
As mentioned above, these three significant areas are focused on:
- Visual stability
- Load time
- Interactivity
Within these areas, the three sub-metrics are called Core Web Vitals. These are important when it comes to analyzing the performance of a website. They are of utmost importance as they measure and evaluate these areas of the user experience.
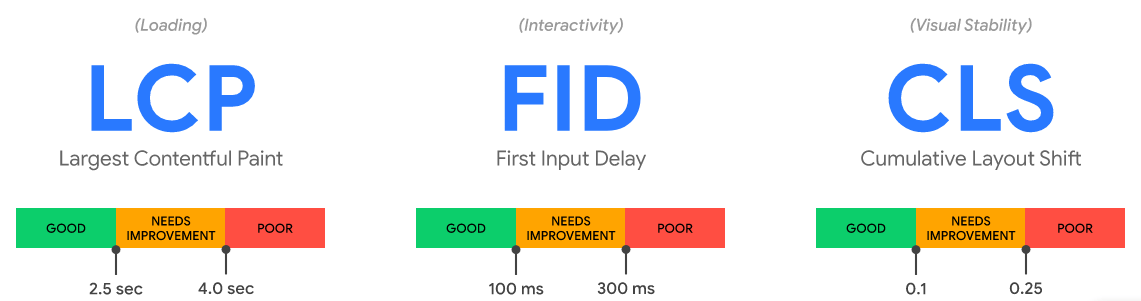
- Largest Contentful Paint (LCP): This is equivalent to load time, and this sub-metric measures the time it takes for your site to appear.
- First Input Delay (FID): This is equivalent to interactivity, like how your site reacts to the user inputs on the site.
- Cumulative Layout Shift (CLS): This measures visual stability. It means that it estimates the site movement while it is loading.
These metrics are of utmost importance to ensure that the website is optimized to ensure optimal usability. Below is a detailed description of each of these subsets.
Largest Contentful Paint (LCP)
As defined above, LCP is the time it takes for a page to load from the point of view of a real user.
In other words, it is how long it takes for something to appear on the screen after clicking on an element that redirects to another page or form, but without scrolling.
The result of this metric can be affected by different factors. This covers server response time, backend elements such as scripts, client-side rendering, media, among others.
However, it only takes into account elements that are relevant to the end-user, such as:
- Images
- Videos
- Text elements
- Headers
- Figures and buttons
- Lists, etc.
On a further deconstruction, it should be noted that this metric does not count the total page load time but the main elements that the user will see, such as those already listed.

How to interpret LCP score
As you may know, there is a standard for each metric. In this case, the loading time should be in the average performance.
Google has a specific demand on load time, which considers:
- 2.5 seconds as good
- 2.5 to 4 seconds means that the website requires improvement
- 4.0 means that the site does not meet the standard in load time.
How to improve LCP?
Constant monitoring of this metric is essential for a positive overall score, and any changes need to be reviewed to detect possible causes and their respective areas of improvement. But then, how can this metric be improved?
In many cases, the poor ranking of this metric is determined by the content itself to be uploaded. While it is strongly influenced by processes and background elements such as scripts and server response, there are alternatives to optimize the content and thus improve the user experience. Below are ways to optimize the LCP:
Media optimization
Images and videos tend to be recurring elements and are one of the elements that tend to take the longest to load on a website. Changing the size of the image or video for each site display (mobile or desktop) as well as the format are ways to improve. Compressing images is also a great way to avoid overloading and to avoid a poor LCP rating.
Good hosting service
About the fact that the response time of the hosting is crucial in the LCP, you can improve the overall loading time of the site with a good host. It must be selected based on your site needs, but it should also have a good reputation in the market to give your website an efficient infrastructure.
Optimize texts and headings
Last but not least, optimizing the text to be displayed also makes a difference. Removing unnecessary text helps to improve the overall loading time of the website. With this, the LCP rating may improve.
First Input Delay (FID)
First Input Delay is determined by how the user interacts with your website and how long it takes for their interaction to reflect on the website. Put another way is the time between a click and what should happen after the click.
Some examples of user interactions can be:
- Enter data into a field
- Clicking on an item in the site navigation
- Selecting something in a menu
- Interactive elements such as drop-down lists
- Checkboxes
This goes along with the LCP as it is influenced by scripts and third-party code. It represents a fundamental part of the final user experience. It is important to remember that the user's attention span is short, so this metric must be kept as optimal as possible, as it determines whether the user decides to stay on your website or not.

How to interpret FID score
As expected, there is a standard in these metrics:
- Less than 100 milliseconds is good.
- 100 to 300 milliseconds need improvement.
- More than 300 milliseconds is poor.
The more background processes and requests are on a website, the longer the delay time will be. Consequently, it is necessary to look for what may be affecting this metric and fix it.
How to improve FID?
There are several ways to reduce the Delay. As already mentioned, many of these solutions are on the backend. Here are some ways to optimize First Input Delay.
Script Optimization
The vast majority of websites often use Javascript to perform processes such as loading images or other elements, which often tend to be impractical and slow down the loading process.
Also, a poorly optimized or unnecessary CSS significantly affects the overall loading time, so optimizing scripts and removing animations and executions of these elements is a way to improve the loading time.
Likewise, by placing them below and adding HTML tags such as "Defer" and "Async" the browser is told not to continue loading other page elements while it finishes rendering the script.
Code Optimization
Code optimization is a must in this metric. The loading of unnecessary or unused code is a factor that strongly affects the delay time. Cleaning up the code and using HTML attributes to organize the loading of images and scripts is an excellent way to reduce response time.
Lazy loading
While there are scripts and sections of code that can be removed, some cannot. It goes from advertisements to external processes, which hinder and affect the time in the FID. For these cases, there is the so-called "lazy loading." which consists of making elements such as images to be loaded when scrolling down the page. The configuration can be done from the
Google Ad Manager control panel.
Cumulative Layout Shift (CLS)
The Cumulative Layout Shift (CLS) is a metric that focuses on the visual stability of content and how various elements react to unexpected layout changes during loading.
For example:
A text appears on the screen, but as it continues to load, that text is moved by ads or images. The same goes for site elements such as navigation menus and forms.
The more elements that do this, the higher the CLS... Which is not good.

How to interpret CLS score
The CLS score is interpreted as follows:
- Less than 0.1 is good
- from 0.1 to 0.25 needs improvement
- More than 0.25 is poor.
A good user experience implies that the CLS remains at less than 0.1. A high CLS score translates into the user having to relearn the location of elements on the site or performing an undesired action.
CLS scores all the change ratings in the initial design of your website for each unexpected change that occurs during the entire visit duration on the page. These changes are divided into two parts: "impact fraction" and "distance fraction."
The
impact fraction, as its name might suggest, is the area in which elements shifted. It is usually delimited by regular margins, like those of a document, but it can have any shape. The impact fraction is, in other words, the fraction of the page visible without scrolling. The full-page scrolling is then called the "impact region."
The
distance fraction is determined by the movement distance. This is the distance between the original or default position of an element and the position where it is repositioned after the layout shift.
How to improve CLS?
As previously mentioned, these Layout Shifts can be caused by elements of our site or by external elements, such as advertisements and others. This is why we list ways to improve your CLS:
Animations
Some animations, if not well designed or optimized, may cause a bad score in the CLS. It is worth mentioning that Google does not consider CSS animations; if they are intentional, not all of them affect the CLS.
Image Sizing
As part of the two metrics already described, it is well known that images are a factor that impacts the user experience and performance of our website. In this case, give a specific size, behavior, and format to our images. In this way, the browser will be able to display these elements correctly.
Embedded elements
Elements such as ads, embedded elements, or iframes may be affecting this metric as well. Giving them a specific size and animations can reduce layout shifting.
Likewise, in the specific case of advertisements, you can do the following:
- Leave intentional space for ads.
- Do not place non-sticky ads near the top of the page.
- Pre-size the ads space.
In the case of embeds, iframes, and other elements, these can be preformatted in the website's scripts and HTML.
FOIT/FOUT
These terms stand for Flash of Invisible Text and Flash of Unstyled Text. As their names imply, they are ways in which the browser renders text. When the page loads, it has to "call" the font scripts, which are relatively large files. While the browser decides what to do with the text while waiting for these files, it has two ways to interpret it.
- The first would be to make the text invisible for a moment to hide it until it finishes loading the font files.
- The second would be to show the text for a moment, but with default font styles, and then change it to the one it is supposed to have.
The behavior that the text has depends on the browser and device where the website is displayed. As with images and embeds, giving the browser a previous instruction of what to do with the text in these cases can optimize the CLS. You can do this from the CSS with a
@font-face.
Core Web Vitals: How to measure and optimize
Now that we've broken down the Core Web Vitals, it's time to look at how to work with these results. First, we need to identify the types of data we can collect.
The results are divided into two types:
Lab Data and Field Data.
Lab Data
Lab Data is the information that results from a controlled environment. That is, creating specific situations and devices for what you want to measure, simulating a real environment. Thank this, processes and results can be repeated since everything that makes up the user experience are controlled, from the hardware and internet connection to the software. It is mainly used to create real-time results, testing, and debugging.
Field Data
Field Data is the information collected in the last 28 days. This information comes from users and situations with real variables and is mainly used to show how your pages perform based on real-world usage data. In this, variables such as internet connection, device, and location may vary.
These data types are also divided into
desktop data and
mobile data.
Field Data can be viewed separately on mobile and desktop in the tools that Google provides, such as
PageSpeed Insights and
Google Search Console.
Measuring Core Web Vitals
There are many tools available in the market to measure and interpret Core Web Vitals. In this case, we will focus on the main tools that Google offers for these metrics. These are free to use and help determine what needs to be improved for an optimal user experience.
Google Search Console
Let's start with this tool. In this, an initial analysis is made of which groups of pages on your website require attention, based on Field Data. However, if there is not enough data, it is skipped. This tool creates a report showing results based on the metrics already analyzed throughout this blog. Based on the results of this tool, you can continue with
PageSpeed Insights
With this tool, you can create more specific reports on what can be improved on your website. It should be noted that these reports can be applied to both mobile and desktop data, as well as Field Data and Lab Data. This report breaks down the areas of opportunity for improvement per page, as well as indicating whether or not it complies with an adequate user experience in the Core Web Vitals assessment.
Once the problems and areas for improvement are determined, it is time to improve. For this, Google has specific tools.
Chrome DevTools
In this tool, there is an "Experience Section" where you can detect layout shifting problems to fix visual stability problems.
Also, we have
Lighthouse, which is used with DevTools to find accessibility and performance improvements. Lighthouse introduces non-Core Vitals metrics and a way to measure composite performance. One of these metrics is the
Total Blocking Time (TBT).
TBT measures the total amount of time between
First Contentful Paint (FCP) and
Time to Interactive (TTI), which are non-Core Vitals metrics.
According to
web.dev, FCP is the time between the start of page load until any part of the page content renders.
On the other hand,
TTI
is the time between the start of page load until its main sub-resources have loaded to respond reliably and quickly to user input.
Working on these metrics is
a way to improve interactivity and is closely related to the FID.
Finally, there is the
Chrome User Experience Report (CrUX). It is a dataset with real data regarding user experience on different sites. With this data, developers can compare different types of user experiences among their competitors, or in case they don't have real user monitoring, the CrUX provides a convenient way to evaluate your Core Web Vitals practically.
Chrome User Experience Report data is available via:
- PageSpeed Insights: It provides URL-level user experience metrics for popular URLs known to Google web crawlers.
- The public Google BigQuery project: It aggregates user experience metrics by origin, for all origins known to Google web craw, divided into connection type, device, and country.
- The CrUX dashboard in Data Studio: To track user experience trends origins.
Conclusion
Web Vitals is a tool that provides the basis and tools to offer an optimal service on any website. Therefore, the Core Web Vitals are metrics that should not be overlooked, and that will positively influence the impact that the website will have on the end-users.
While these metrics measure crucial aspects of a website, they are not absolute. They are still in constant development and growth, because new metrics or functionalities may be added in the future to improve the user experience.
Something important to remember is that
Google considers the LCP, FID, and CLS to position us and determine whether we offer a good user experience or not. If not, the standard is not met.
In Antares Systems we have a team of developers and web designers passionate about the work, which have the knowledge and tools to create websites focused on good positioning and optimal user experience. If you need help, feel free to
contact us!